Histogram
A multipurpose audio/video analysis tool.
Syntax and Parameters
Histogram (clip, string "mode", float "factor", int "bits", bool "keepsource", bool "markers",
string "matrix",
string "graticule", bool "targets", bool "axes", bool "iq", bool "iq_lines", bool "circle",
bool "targets100")
- clip
Source clip; bit depths greater than 8 are supported in Classic, Levels, Luma and Colors modes only.
Classic, Color, Color2 and Luma modes support all planar YUV(A) formats.
Levels mode support RGB24/32/48/64 and all planar RGB(A)/YUV(A) formats.
Audiolevels and StereoOverlay modes support all 8-bit YUV(A) formats.
Stereo and StereoY8 accept any 8-bit format but always return a 512x512 YUV420P8 or a Y8 clip respectively. If only an audio clip is given then the output clip will have a framerate of 25FPS.
Audiolevels and Stereo* modes support all audio samples types.
- mode
Select the
modeto display:"Classic" : waveform mode;
"Levels" : RGB/YUV/Y histogram mode;
"Color" : vectorscope mode;
"Color2" : vectorscope mode with overlays;
"Luma" : special viewing mode;
"Audiolevels" : audio level meter; and
"Stereo", "StereoOverlay", "StereoY8" : audio graphs.
Default: "classic"
- factor
Applies only to Levels mode. The
factoroption specifies the way how the graphs are displayed, exaggerating the vertical scale. It is specified as percentage of the total population (that is number of luma or chroma pixels in a frame). For example,Histogram("Levels", 1.5625)will achieve a 1/64th cap. The vertical scale is multiplied by 100.0 /factor.Range: 0.0 - 100.0Default: 100.0
- bits
Accepts 8, 9, 10, 11 or 12 as input. Applies only to Classic, Levels and Color/Color2 (vectorscope) modes.
Classic, Levels: increases the width of the histogram by 2(bits-8)
Color/Color2: increases width and height of the histogram by 2(bits-8)
For example,
Histogram(bits=10)returns a 1024-pixel wide histogram (width is 256 by default).Default: 8
- keepsource
If true, add histogram to right side of existing clip; else return the histogram portion only. Applies only to Classic, Levels, Color and Color2 modes.
Default: true
- markers
If true, show calibration marks (see screenshots); else hide them. For Levels mode it will also remove the colored background. Applies only to Classic and Levels modes.
Default: true
- matrix
Applies to Color/Color2 mode. Specifies the YUV matrix used to interpret the chroma values of the input clip, and determines the correct U/V positions of the color bar target boxes and I/Q markers drawn on the vectorscope.
Accepted values follow the same convention as the
ConvertToYUVfamily of functions, for example:"2020","709", etc..If not specified, the matrix is read from the clip's
_Matrixand_ColorRangeframe properties. If those are absent, BT.601 is assumed.Default: (empty, means auto from frame properties or else BT.601)
- graticule
Applies only to Color and Color2 modes. Controls the visibility of the graticule overlay — the valid chroma range boundary square (16–240 in 8-bit, scaled for higher bit depths) in Color2 mode, and the danger zone shading in Color mode.
"on"(default): Always draw the graticule, regardless of the clip's color range. This preserves the behavior of versions prior to 3.7.6."off": Never draw the graticule."auto": Draw the graticule only for limited-range clips. For full-range clips, where the valid chroma area extends to the display edges, the graticule is suppressed to avoid clutter.
Default:
"on"
- targets
Applies only to Color and Color2 modes. If true, draw small target boxes on the vectorscope at the expected Cb/Cr positions of the six 75%-amplitude colour bar colours (Yellow, Cyan, Green, Magenta, Red, Blue). The positions are computed from ground-truth linear RGB values converted through the active
matrix, and the limited or full range property of the clip, giving accurate targets for any supported matrix and bit depth.The target positions correspond to the 75% signal level as used by ColorBars and ColorBarsHD. They are also the correct reference positions for ColorBarsUHD content after SDR conversion, since the three test patterns share the same scene light level at their respective reference amplitudes:
ColorBarsHD 75% bars → land on 75% targets directly.
ColorBarsUHD HLG (mode=0) 75% BT.709-equivalent bars → land on 75% targets after scene-referred HLG→SDR conversion (ITU Fig. 10).
ColorBarsUHD PQ (mode=1) 58% BT.709-equivalent bars → land on 75% targets after scene-referred PQ→SDR conversion at 1000 cd/m² reference, because the 58% PQ signal level corresponds to the same scene light as 75% HLG at the 1000 cd/m² reference (203 cd/m² diffuse white).
For the HLG/PQ source signal (before SDR conversion), convert to YUV first and set
matrixto"709"(or"2020"all the same, drawing is matrix-aware) to see the BT.709-equivalent bottom bars land on 75% targets:src = ColorBarsUHD(pixel_type="RGBP10", mode=0) src.ConvertToYUV444(matrix="709:same").Histogram("color2", targets=true)
Default: false
- targets100
Applies only to Color and Color2 modes. If true, draw small target boxes on the vectorscope at the expected Cb/Cr positions of the six 100%-amplitude colour bar colours. The positions are computed from the same ground-truth linear RGB primaries as
targets, scaled to full saturation (100% signal level), using the activematrixand colour range.These targets are useful for validating HDR-to-SDR conversions where HDR primary colour bars exceed the SDR gamut and are hard-clipped. Specifically, after a scene-referred HLG→SDR or PQ→SDR conversion, the 75% HLG and 58% PQ primary colour bars (Row 2 of ColorBarsUHD) clip to exactly 100% SDR amplitude and should land on these targets:
fmtconv scene-referred: bars land exactly on the 100% targets — confirming high numerical precision of the analytical conversion path.
zimg/avsresize scene-referred (as of 20260317 patch needed): bars land approximately on the 100% targets with small scatter — due to LUT quantisation in the per-channel gamma path.
Display-referred conversion: bars land approximately near the 100% targets but with visible scatter between bars of the same hue group, because the luminance-weighted OOTF scales each bar by a different factor depending on its luminance content. This scatter is physically correct and expected — the BT.709-equivalent bars were designed to hit targets for scene-referred conversion only (per ITU-R BT.2111-3 Attachment 3).
Default: false
See also ColorbarsUHD vectorscope example
- axes
Applies only to Color and Color2 modes. If true, draw horizontal and vertical crosshair lines through the center of the vectorscope, marking the U (Cb) and V (Cr) axes.
Default: false
- iq
Applies only to Color and Color2 modes. If true, draw target boxes for the NTSC −I, and +Q (ColorBars) and +I (ColorBarsHD) chroma-phase reference signals. These are defined by the luma-corrected broadcast convention (Option 2 below) and are computed through the active
matrix.The −I and +Q signals are traditionally zero-luma, 20 IRE saturation chroma axis references from the NTSC subcarrier standard. Three interpretations exist in digital studio-swing environments:
For displaying them on RGB or YUV, "hack" is needed to reach valid RGB/YUV values, for more information see ColorBars documentation.
Default: false
- iq_lines
Applies only to Color and Color2 modes. If true, draw radial lines on the vectorscope passing through the −I/+I and +Q/−Q axis positions. Together with
axes, this produces the full eight-line graticule (four cardinal lines at 0°/90°/ 180°/270° and four diagonal lines through the I/Q phase references) commonly seen on broadcast vectorscopes.The diagonal line angles are not derived from the actual computed I/Q U/V positions, and use always textbook values of 33°/123°.
Default: false
- circle
Applies only to Color and Color2 modes. If true (default for color2), draws hue circle with 15° tick marks around the circumference.
Default: true ("color2"), false ("Color")
Classic mode
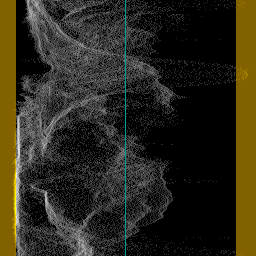
This will add a per-line luminance graph (called a Waveform Monitor) on the right side of the video. The left side of the graph represents the minimum pixel value (0) and the right side represents the maximum pixel value (for example, 255 for 8-bit). Values outside the valid CCIR-601 range are shown in a brown/yellow-ish color, and a greenish line represents the midpoint for limited range (e.g. 126 for 8-bit since the median of [16,235] is 125.5).
Levels mode
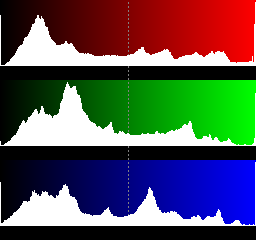
This mode will display three histograms on the right side of the video frame. This will show the distribution of the R,G,B or Y,U,V components in the current frame.
The top graph displays the luma (R) or red (Y) distribution of the frame, where the left side represents the minimum pixel value (0) and the right side represents the maximum pixel value (for example, 255 for 8-bit). For YUV, the valid CCIR-601 range has been indicated by a slightly different color. The midpoint is marked with a dotted line (for example, 128 for 8-bit). The vertical axis shows the number of pixels for a given luma (Y) value. The middle graph is similar and displays the G or U component, and the bottom graph displays the B or V component.
Color mode
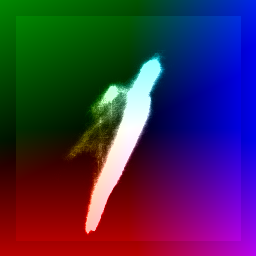
This mode displays the chroma values (U/V color placement) in a two-dimensional
graph called a vectorscope, appended to the right side of the video frame.
It functions as a histogram at the same time: the whiter a pixel in the
vectorscope, the more pixels of the input clip share that chroma value. The
shaded background denotes the valid CCIR-601 range (danger zone
shading can be controlled with the graticule parameter).
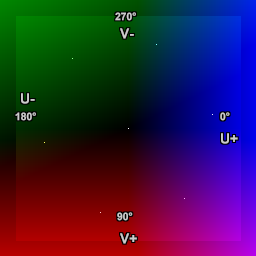
Labels have been added to the second image for reference, showing the U and V axes and degrees of hue. Spots show 75% saturated ColorBars (clockwise from 0°: blue, magenta, red, yellow, green and cyan).
The U component is displayed on the horizontal (X) axis (left = 0, right = 255) and the V component on the vertical (Y) axis (top = 0, bottom = 255).
A spot's position on the scope corresponds to a chroma value from the input clip. As hue changes, the spot moves around the center; as saturation changes, it moves in or out. The center (U=V=128) represents zero saturation — no color. At U=255, V=128 the hue is zero (blue) at maximum saturation: saturation = sqrt( (U-128)2 + (V-128)2 ) = 127. Turning hue clockwise 90° gives U=128, V=255 (red, approximately). Decreasing saturation at constant hue moves the spot toward the center, fading the color to greyscale.
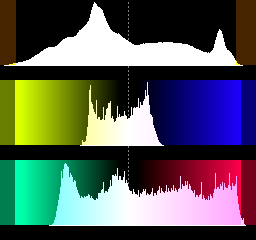
Color2 mode
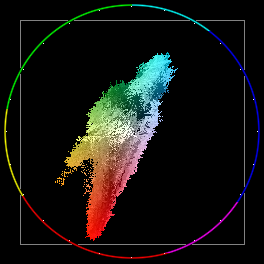
This mode displays pixels in a two-dimensional vectorscope appended to the right side of the video frame. It can be used to read the hue and saturation of a clip.
The U and V axes are laid out identically to Color mode (see above). The grey square (graticule) denotes the valid limited-range Cb/Cr boundary (16–240 in 8-bit; see also CCIR-601).
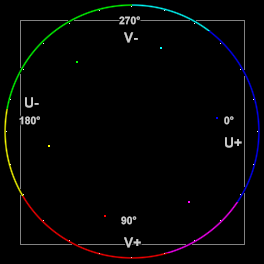
As in Color mode, labels and ColorBars dots have been added to the second image for reference.
Unlike Color mode, the background is black rather than shaded, the signal dots are brighter and rendered in color, and a color wheel is drawn around the circumference of the scope divided into six hues (clockwise from 0°: blue, magenta, red, yellow, green and cyan) with white tick marks at 15° intervals.
Vectorscope overlays: Color and Color2
Both Color and Color2 modes share a common set of optional overlays. The fundamental difference between the two modes is that Color operates as a density histogram plotted over a pre-drawn UV shade background, while Color2 plots individual pixels on a black background with a color wheel.
Both modes are matrix-aware: the matrix parameter (or the clip's _Matrix
and _ColorRange frame properties) controls how chroma values are interpreted
and where overlay markers are positioned, giving accurate results for BT.601,
BT.709, BT.2020 and other supported matrices at all bit depths.
Optional overlays:
Parameter |
Color default |
Color2 default |
Description |
|---|---|---|---|
graticule |
|
|
Danger zone shading (Color) or valid
chroma boundary square (Color2).
|
targets |
false |
false |
Target boxes at the six 75% colour bar Cb/Cr positions. Matrix-aware. Useful for ColorBars, ColorBarsHD, and ColorBarsUHD after SDR conversion. |
targets100 |
false |
false |
Target boxes at the six 100% colour bar Cb/Cr positions. Matrix-aware. Useful for validating HDR primary bars after SDR conversion where HLG/PQ primaries clip to 100% SDR amplitude. |
axes |
false |
false |
Horizontal and vertical crosshair through the scope center. |
iq |
false |
false |
Target boxes for the NTSC −I, +I and +Q phase references. |
iq_lines |
false |
false |
Radial lines at the fixed 33°/123° NTSC I/Q phase angles. |
circle |
false |
true |
Hue circle with 15° tick marks around the circumference. |
Example usage:
# ColorBars / ColorBarsHD: 75% targets with BT.601/BT.709 auto-detected
ColorBars()
Histogram("color2", targets=true, axes=true, iq=true, iq_lines=true)

# ColorBarsHD with explicit BT.709 matrix
# Here unnecessary, "color2" knows it from frame properties set to 709,limited
ColorBarsHD()
Histogram("color2", targets=true, matrix="709:l")

# ColorBarsUHD HLG source: view in BT.2020 Cb/Cr space
# BT.709-equivalent bottom bars land on BT.2020 75% targets
ColorBarsUHD(pixel_type="RGBP10", mode=0)
Histogram("color2", targets=true, targets100=true)

# ColorBarsUHD HLG after scene-referred SDR conversion:
# 75% HLG primary bars clip to 100% SDR → use targets100
# BT.709-equivalent bottom bars land on 75% targets → use targets
z_ConvertFormat(last, pixel_type="RGBP10",
    \ colorspace_op="auto:auto:auto:l=>rgb:709:709:l",
    \ nominal_luminance=203.15, use_props=1,
    \ approximate_gamma=false, scene_referred=true)
ConvertToYUV444(matrix="709:same")
Histogram("color2", targets=true, targets100=true)

# Override matrix interpretation to BT.709 for an SD clip tagged as 601
Histogram("color2", matrix="709", targets=true, iq=true)

# Suppress the graticule only for full-range clips
Histogram("color2", graticule="auto")

# Switch on all overlays in Color mode
Histogram("color", graticule="on", targets=true, targets100=true,
    \ axes=true, iq=true, iq_lines=true, circle=true)
See also ColorbarsUHD vectorscope example
Luma mode
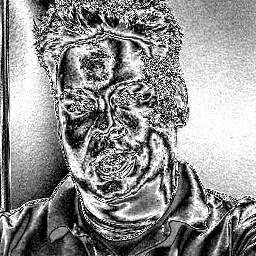
This mode will amplify luminance, and display very small luminance variations. This is good for detecting blocking and noise, and can be helpful at adjusting filter parameters. In this mode a 1-pixel luminance difference will show as a 16-pixel luminance pixel, thus seriously enhancing small flaws.
Stereo, StereoY8 and StereoOverlay mode
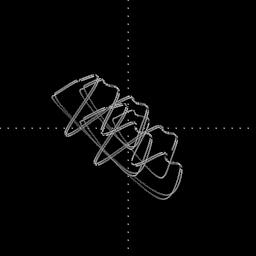
This mode shows a stereo graph (known as a goniometer or phase scope), from the audio in the clip. This can be used to see the left-right and phase distribution of the input signal. Each frame will contain only information from the current frame to the beginning of the next frame. The signal is linearly upsampled 8x, to provide clearer visuals. Only StereoOverlay will overlay the graph on top of the source clip. Stereo and StereoY8 just return a 512x512 clip of the graph.
AudioLevels mode
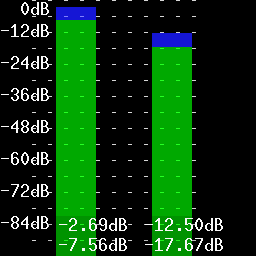
Shows the audio levels in decibels for each channel present. For example, if the source has six channels of audio, six vertical bars will be shown. The audio levels are overlaid over the source clip.
The green bars show the RMS level and the blue bars show the max (peak) level, both are calculated with the formulas listed below. The color of the bar changes color to red and yellow whenever that specific channel's peak reaches 0.0dB.
Formulas
The green bars show the RMS (Root Mean Square) level of the audio in each video frame (let's say n samples) using the following formula:
The blue bars show the max (peak) level of the audio in each video frame using the following formula:
The maximum possible level without clipping is 0 dB by definition. The minimum level for 16 bit audio is therefore:
Changelog
Version |
Changes |
|---|---|
AviSynth+ 3.7.6 |
Vectorscope modes: added
matrix, graticule,
targets, axes, iq, iq_lines, circle
parameters.Vectorscope modes: matrix-aware; target box
and I/Q overlay positions are computed from ground-truth
linear 75% RGB values through the active YUV matrix, giving
accurate results for BT.601, BT.709, BT.2020 and other
supported matrices at all bit depths including float.
Vectorscope modes: copy alpha from clip, initialize alpha
to zero in the histogram area.
Vectorscope modes: accurate pixel positioning and scaling
to the active histogram area, limited/full range aware.
|
AviSynth+ 3.7.2 |
Added support for all YUV(A) formats (10-16 bit and float)
in "Luma" mode.
Fix: prevent crash when factor=0 in "Levels" mode.
Fix: "Levels" mode: fix incorrect "factor" applied for U/V
part drawing when format was subsampled (non-444).
Make "factor" a named parameter (previously an unnamed
optional parameter).
Fix: check for Planar RGB in "Audiolevels", "Color",
"Color2" and "StereoOverlay" modes.
Levels mode: stop using shades of grey on top of bars.
Levels mode: use bar color 255 for RGB instead of Y's 235.
(and scaled equivalents).
Fix: "Color" mode may crash on certain dimensions for
subsampled formats.
Fix: "Color2" missing CCIR rectangle top and bottom line.
|
AviSynth+ 3.7.0 |
Added support for all YUV(A) formats (10-16 bit and float) in "Color2" mode. |
AviSynth+ 3.6.1 |
Added greyscale support in "Levels" mode. |
AviSynth+ 3.4.0 |
Added
keepsource and bits parameters.Added support for RGB24/32/48/64 and all planar
RGB(A)/YUV(A) formats in "Levels" mode.
Added support for all YUV(A) formats (10-16 bit and float)
in "Classic" mode.
|
AviSynth 2.6.0 |
Added "StereoY8" mode.
Added factor option to "Levels" mode.
Improve colour of chroma legends in "Levels" mode.
|
AviSynth 2.5.8 |
Added "Color2" and "AudioLevels" modes.
Added YV12 support.
|
AviSynth 2.5.6 |
Added invalid colors in YUY2 mode. |
AviSynth 2.5.5 |
Added dots to "Stereo" mode to show bias/offsets. |
AviSynth 2.5.4 |
Added "Luma", "Stereo", and "StereoOverlay" modes. |
AviSynth 2.5.3 |
Added |
AviSynth 2.5.0 |
Added markers to show invalid colors in YUV. Invalid values (below 16 and above 235) will be colored brown/yellow-ish. |
$Date: 2026/02/19 $
