Debugging instructions
How to debug AviSynth
xx
How to debug AviSynth plugins
Two ways are described to debug your plugin. An easy way using DebugView and the use of VC++6's debugger. In both cases, the sample code SimpleSample is used.
How to debug AviSynth plugins (the short way)
An easy way to debug AviSynth plugin is to use a utility called DebugView for Windows which captures OutputDebugString's output from your code (OutputDebugString sends a string to your debugger). It's a bit limited. So, if this is not sufficient, you should use a debugger as described in the next section.
1) Open Dbgview.exe. Make sure that 'Capture Win32' under the Capture tab is selected.
2) Add the following line at the start of your code:
#include <stdio.h> /* for using sprintf */
Add, for example, the following lines in your code to check whether certain parameters are passed to the code path which comes after it:
char BUF[256];
sprintf(BUF, "framenr %d, text %s, height %d, pi %f\n", n, "hey", src_height, 3.14);
OutputDebugString(BUF);
Thus:

Nb, %d means integer, %s means string and %f means float/double. n means add a new line.
4) Open your script and scroll through it. You will see the following output in DebugView:
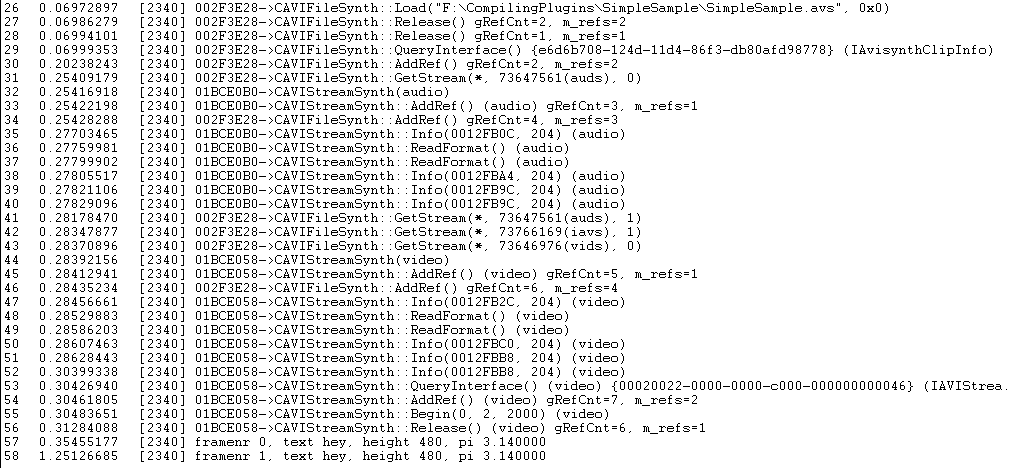
In the example the script is loaded in line 26. After that some AviSynth output is captured. In the lines 57 and 58 the output of OutputDebugString is written.
If your script crashes somewhere, you should put these lines just before the crash (it may take a few attempts to find that point). Then you should pass the values of the relevant parameters and check whether they are correct. Apparently there is some parameter whose value is empty or invalid.
How to debug Avisynth plugins (for MS VC++ 6.0)
These are the steps to debug an AviSynth plugin in VC++ 6:
1. Go to the build tab and set the Active configuration to the Debug version of your plugin.
2. Build the debug version of your plugin. Thus go to the build tab and Build (...).
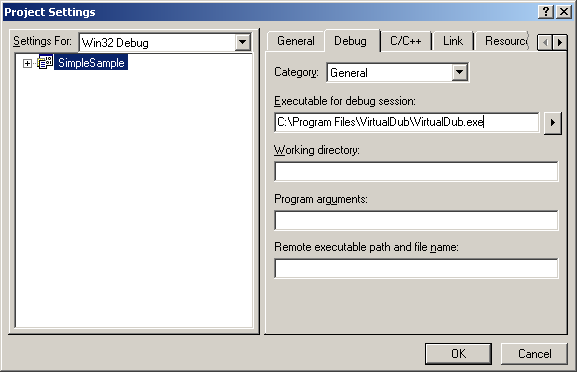
3. We will use VirtualDub.exe to debug your plugin. Go to Project tab, then select Settings -> Debug -> General -> Executable for debug session -> browse to a version of VirtualDub.exe and specify that:
4. Go to Project tab, then select Settings -> Debug -> Additional DLLs, and browse to the filter DLL in the Debug directory:

5. Make an AviSynth script that loads and uses your filter. Make sure to load the Debug version of your plugin! Thus for example:
LoadPlugin("F:\CompilingPlugins\SimpleSample\Debug\simplesample.dll")
Colorbars().Trim(0,1)
ConvertTORGB24()
SimpleSample(100)
6. Set breakpoints as required. You can do this by clicking with the right mouse button next to a statement in your code (in the grey section). For example:

Select the option: Insert/Remove Breakpoint:

7. Go to the Build tab, and select Start Debug -> Go (or the shortcut F5). VirtualDub will execute. Open the AviSynth script in that VirtualDub instance. The code will execute up to your first breakpoint (at least if it follows that code path):
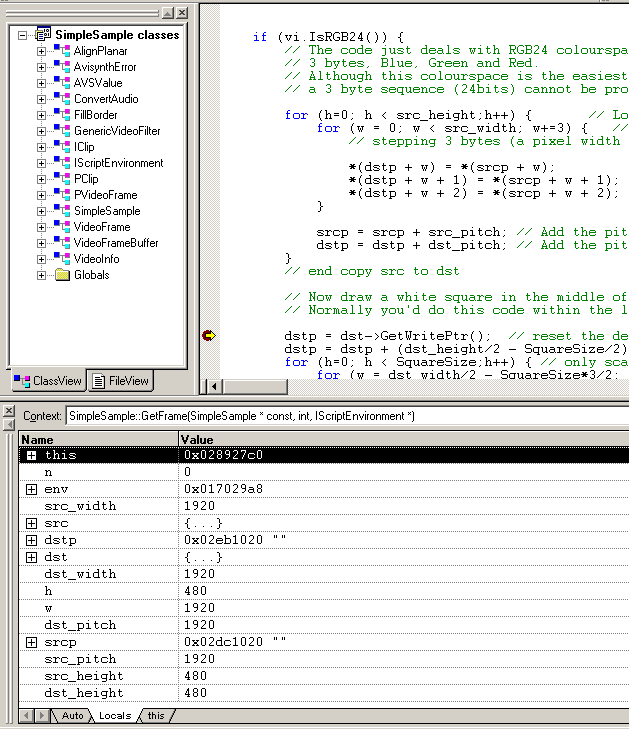
You will see a yellow arrow through your breakpoint.
Above I also opened the 'variables output window'. It is under the View tab -> Debug Windows -> Variables. You can view the value of the variables when stepping through your code. Use Debug -> Step Into (or the shortcut F11) to step through your code. Use Debug -> Step Over (or the shortcut F10) to step over function calls.
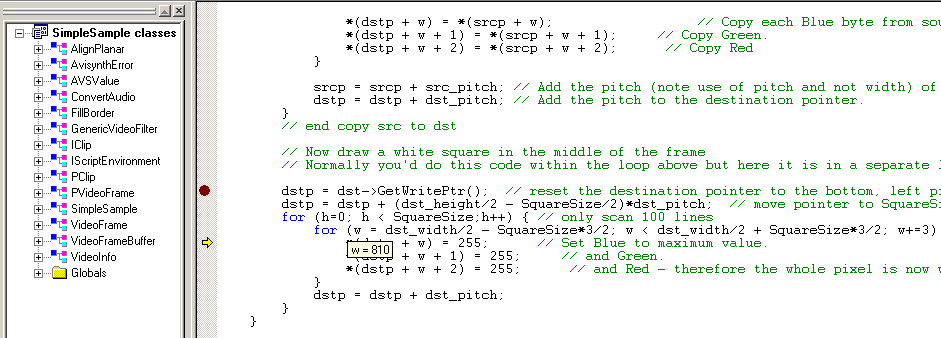
When moving your mouse over a variable, you can also see the value of it:
If you want to set a breakpoint somewhere else, just remove the existing one (by right clicking on it). Put a new one somewhere and press F5.
If you want to stop debugging, go to the Debug tab -> Stop Debugging.
How to debug Avisynth plugins (for MS VC++ 2010)
Open your project. Select the debug build and build it. Make sure that you load the debug build in your script.
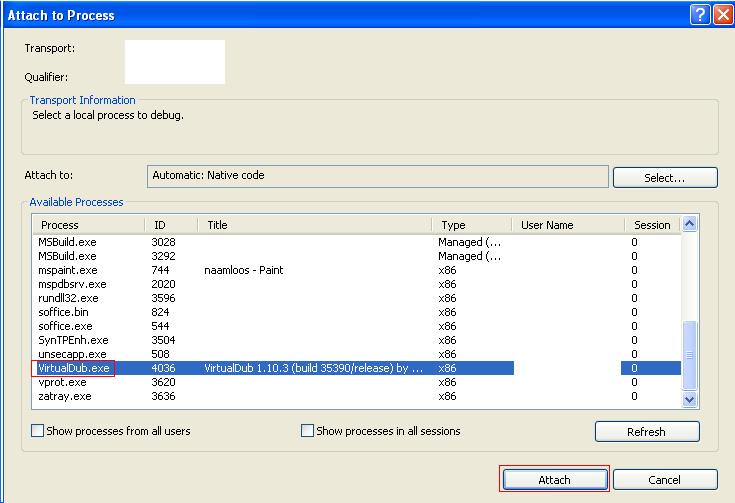
Open Virtualdub and attach is to the debugger:
Debug > Attach to Process

Select VirtualDub.exe and press attach:
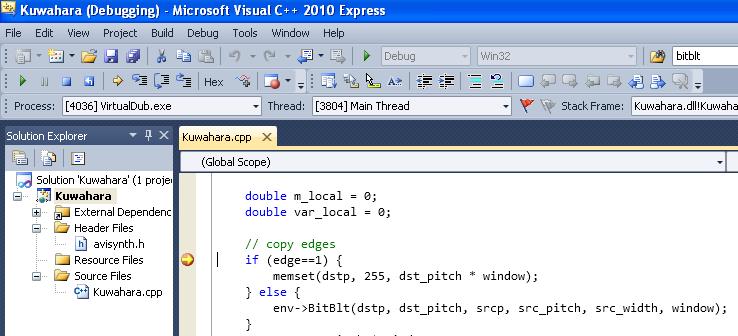
Set a breakpoint somewhere. You can do this by clicking with the right mouse button next to a statement in your code (in the grey section):

Open the script in Virtualdub and the code will be executed up to point where you set the breakpoint.
Instead of attaching Virtualdub to the debugger every time, you can also do the following:
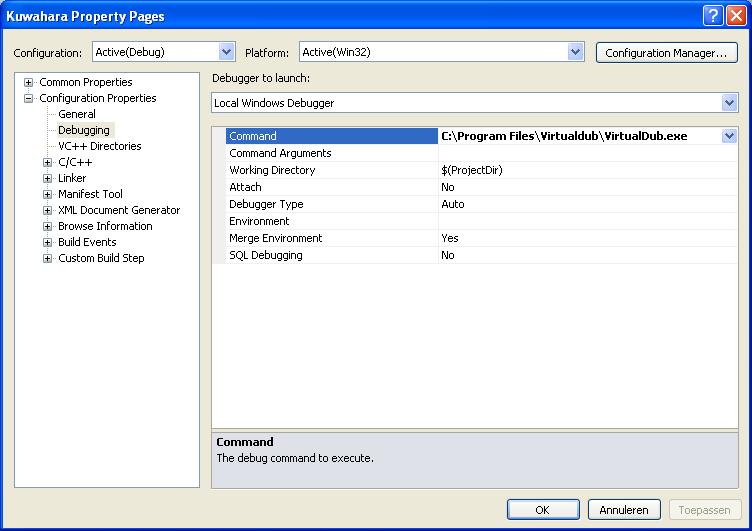
Right click on the project name (Kuwahara in our case) > Properties > Configuration Properties > Debug
Enter the location of Virtualdub in the debug command:
If you set a breakpoint somewhere and start the debugger:
Debug > Start Debugging
It will open Virtualdub and you can open your script to start the debugging session.
How to debug Avisynth console applications (for MS VC++ 2010)
Open your project. Select the debug build and build it. Make sure that you load the debug build in your script.
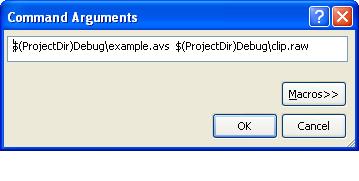
Right click on the project name (Kuwahara in our case) > Properties > Configuration Properties > Debug
Enter the location of your console application and its arguments in the debug command (in our case: avs2yuv.exe example.avs clip.raw):

Set a breakpoint somewhere and start the debugger:
Debug > Start Debugging
It will open the command prompt and start the console application. The script will be executed to start the debugging session.
Debug info from MAP file
IanB wrote: Recent versions of Avisynth now ship with an avisynth.map! You can use this accurately get routine addresses. Avisynth preferably loads at 0x10000000, use the debugger loaded module display to check this.
Build your plugin in debug mode. If you can, build yourself a Debug or Relsym avisynth.dll and debug it, if not the use the .map file provided to interprete the Call stack addresses.
Back to AviSynth FilterSDK
$Date: 2014/10/27 22:04:54 $
